Chart Describer is an infobox that contains technical analysis highlights for the chart you are currently using. Here is how you can find and use Chart Describer:
1. To access Chart Describer, click on the Chart Describer button  above your chart.

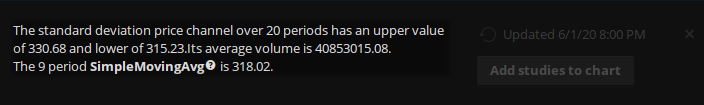
2. Based on the type of security and the time frame you are viewing the chart for, the system selects a set of the most popular technical indicators and shows you their current values. In addition, it indicates recent drastic price moves and breakouts.
Clicking on the name of the technical indicator shown in Chart Describer will bring up a short description of that technical indicator. To view the full description of an indicator, click on its name in Chart Describer, scroll down the infotip window, and click More details.
3. Chart Describer data is automatically updated at regular intervals. For charts with an aggregation period of five minutes or less, the update interval is equal to the aggregation period. For charts with longer aggregation periods, the data is updated once every five minutes. You can manually update the data by clicking on the Update button in the Chart Describer box.
4. By default, the technical indicators shown in Chart Describer are not displayed on the chart. To add all the indicators shown in Chart Describer to chart, click on the Add studies to chart button.
Note: You can also use Chart Describer as a gadget on the Left Sidebar.