Chart Describer is a thinkorswim gadget that provides you with recent technical analysis highlights on a desired symbol. The highlights shown in Chart Describer include recent values of popular studies or drastic price changes and breakouts. Like all other gadgets, Chart Describer can be displayed as a section of the left sidebar or a separate window (see the Left Sidebar article for details).
How to use Chart Describer:
1. Choose the desirable symbol in the symbol selector. Next to the symbol selector, you will see the symbol description, its current market price, and the absolute/percentage price change since midnight.
Consider linking Chart Describer to a watchlist using the color-coded clipboard available from the 'clip icon' menu. This way, clicking through the watchlist will immediately display the corresponding symbols in Chart Describer. More information on color linking in watchlists: here.
2. Based on the security type you are viewing the data for, the gadget will display a predefined set of timeframes. For each of the timeframes shown, the system calculates the most popular technical indicators and checks whether there are recent drastic price changes or breakouts.
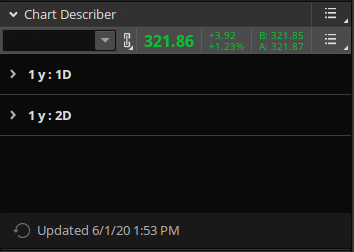
To view the calculated values and other highlights for a timeframe, click on the tick before that timeframe. This will expand the list of highlights available for that timeframe.
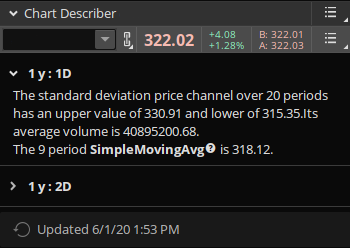
Clicking on the name of a technical indicator shown in Chart Describer will bring up a short description of that technical indicator. To view the full description of an indicator, click on its name in Chart Describer, scroll down the infotip window, and click More details.
3. Chart Describer data is automatically updated at regular intervals based on the shortest aggregation period currently shown in the gadget. If the shortest aggregation period is five minutes or less, the update interval is equal to that aggregation period. If it is longer, the data is updated once every five minutes. You can manually update the data by clicking on the Update button below the Chart Describer box.