The Heikin Ashi chart is a type of candle chart. Its coloring is similar to the coloring on the Candle chart, however, the open, close, high, and low prices are based on midpoints of current and previous candles. The formulas converting the actual prices values into the Heikin Ashi price values are shown in the following table:
| haClose = (open+high+low+close)/4 |
Heikin Ashi Close: The arithmetic mean of the current high, low, open, and close prices. |
| haOpen = [haOpen(Previous Bar) + haClose(Previous Bar)]/2 |
Heikin Ashi Open: The midpoint of the previous candle. |
| haHigh = Max(high, haOpen, haClose) |
Heikin Ashi High: The highest of the following: the actual high, the Heikin Ashi Open, or the Heikin Ashi Close. |
| haLow = Min(low, haOpen, haClose) |
Heikin Ashi Low: The lowest of the following: the actual low, the Heikin Ashi Open, or the Heikin Ashi Close. |
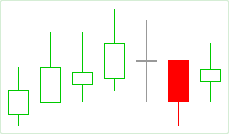
Sample
Default Colors
|
Component |
Dark L&F |
Light L&F |
|---|---|---|
|
Border Up |
|
|
|
Border Down |
|
|
|
Neutral Tick |
|
|
|
Fill Up |
|
|
|
Fill Down |
|
|