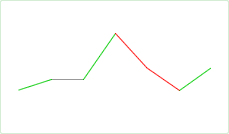
The Line chart displays segments that connect the adjacent close prices on the chart. This chart does not provide any information about the open, high, or low prices.
Algorithm
If the current close price is less than the previous one, the line between them is shown in the "down-tick" color. If it is greater, the line is displayed in the "up-tick" color. In case the two prices are equal, the line is shown in the "neutral-tick" color.
To customize the color scheme of the Line chart, use the Appearance Settings.
Sample
Default Colors
|
Component |
Dark L&F |
Light L&F |
|---|---|---|
|
Up Tick |
|
|
|
Down Tick |
|
|
|
Neutral Tick |
|
|