The Simple Moving Average (SMA) is basically the arithmetic mean of preceding prices on a specified time period. Being ubiquitous in technical analysis, it is the simplest tool for trend determination. In thinkScript®, this type of moving average can be calculated by calling function Average with the following syntax:
def avg = Average(close, 9);
This will calculate the Simple Moving Average of Close price over last nine bars. Note that just like all the other averages, SMA has a default value for period on which it should be calculated: for this type of average it is equal to 12. In other words, if you omitted the 9 in the script above and just typed
def avg = Average (close);
The 12 period SMA of Close price would be calculated.
Compared to other averages, SMA assigns equal weight to each day’s price which, by some chartists, is believed not quite correct: according to them, heavier weight should be given to the more recent data.
In order to eliminate this problem, Weighted Moving Average (WMA) was designed: this type of average artificially assigns weight to prior prices by using specific coefficient when calculating the mean value. To calculate the WMA, thinkScript® multiplies each prior price on the specified period by weight factor equal to sequence number of its bar on the specified period and then the total sum of these values is divided by the sum of multipliers. Therefore, most weight is given to the current bar and least to the first one. Here is the syntax of WMA function:
def avg = WMA(open, 10);
This script will calculate the 10 period WMA of the Open price. If 10 is omitted, the default value of 9 will be used for the length parameter.
While WMA corrects SMA’s weighting problem, both averages share another disadvantage: their calculation suggests that the oldest value on the period be removed when passing to the following bar which means that only most recent data is taken into consideration. These issues are addressed by Exponential Moving Average (EMA).
Giving more weight to the more recent data, the Exponential Moving Average, however, does not completely eliminate price action prior to the calculation period. This is possible because EMA uses a different calculation mechanism than the SMA does. Here is the formula:
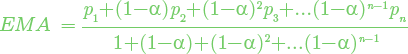
where p1 is the price of the last bar, p2 is the price of the previous bar, and so on, and α is a smoothing coefficient calculated as follows:

where N is equal to length.
EMA smoothing is applied to data by calling the ExpAverage function:
plot avg = ExpAverage(high,9);
This script will plot EMA of the High price with length equal to 9 which makes the smoothing coefficient equal to 20%. ExpAverage has 12 as the default value for the length parameter.
Another method of assigning weights while keeping older data is Wilder’s Average. Its calculation is similar to that of EMA except it uses SMA instead of the price itself as the last term in total sum of prices. Also, in Wilder’s Average, the smoothing coefficient α is equal to 1/N. To use the Wilder’s Average, the following script is suggested:
def avg = WildersAverage(low,20);
This script will plot Wilder’s Average of the Low price with length equal to 20 which makes the smoothing coefficient equal to 5%. Just like SMA and EMA, WildersAverage has 12 as the default value for the length parameter.
In thinkScript®, there is also a generalized function which is able to return all kinds of the mentioned moving averages (and also, the Hull Moving Average): MovingAverage. However, using this function is a bit more complicated as it accepts constants as input parameters. Consider the following script:
input length = 12;
input averageType = AverageType.SIMPLE;
plot MovAvg = MovingAverage(averageType, close, length);
This script will plot 12 period SMA of Close price; however, once added on chart, this study will be able to change the type of average via Edit Studies and Strategies window: input “average type” will allow you to select Weighted, Exponential, Wilder’s, or Hull average instead of the Simple one. This script is also a good example of how constants look in thinkScript®: notation of a constant has two parts separated by a dot where the first part shows constant’s family and the second one is its name. For example, other constants of the AverageType family are:
- AverageType.EXPONENTIAL;
- AverageType.WEIGHTED;
- AverageType.WILDERS;
- AverageType.HULL.
The full list of constants and families they belong to can be found here. There is also information on which functions use a certain family of constants.
In the next chapter we will discuss how to specify conditions in thinkScript®.