Description
The Volume Positive Negative (VPN) indicator is an oscillator developed by Markos Katsanos. Its main purpose is to detect possible high-volume breakouts. As opposed to setting new highs as potential breakout entries, VPN only does so after volume confirmation.
The VPN indicator is calculated as follows:
- The study takes into account two types of volume: positive and negative. Positive volume is the volume related to a bar with typical price at least 1/10 ATR (average true range) greater than the typical price of the previous bar. The opposite defines the negative volume. If the difference between the typical prices is less than 1/10 ATR, the volume of that bar is not taken into account.
- After registering positive and negative volumes during the indicator period, the indicator calculates the sum of each volume over the same period.
- The difference between the total positive and total negative volumes is found.
- The result is divided by the total volume for the period and multiplied by 100.
- The result is smoothed with an exponential moving average.
The resulting VPN plot is a line that oscillates in the -100 to +100 range; however, it tends to oscillate between -80 and +80. Readings higher than the critical value (+10 by default) may indicate a possible bullish breakout. Readings below the negative critical value may signify a possible bearish breakout.
In addition, the indicator displays a moving average of the VPN plot (simple moving average by default).
Input Parameters
| Parameter | Description |
|---|---|
length
|
The indicator period. |
ema length
|
The length of the exponential moving average to smooth the result with. |
average length
|
The length of the average used in the calculation of the plot VPNAvg. |
factor
|
The factor to multiply ATR by when calculating the positive/negative volume. |
critical value
|
Readings higher than this value indicate a possible bullish breakout. Readings lower than the opposite of this value indicate a possible bearish breakout. |
average type
|
The type of the moving average to be used in the calculation of the VPNAvg plot: simple, exponential, weighted, Wilder's, or Hull. |
Plots
| Plot | Description |
|---|---|
VPN
|
The Volume Positive Negative (VPN) indicator plot. |
VPNAvg
|
The average Volume Positive Negative (VPN) indicator plot. |
CriticalLevel
|
The critical level. |
Further Reading
1. "Detecting High-Volume Breakouts" by Markos Katsanos. Technical Analysis of Stocks & Commodities, April 2021.
Example*
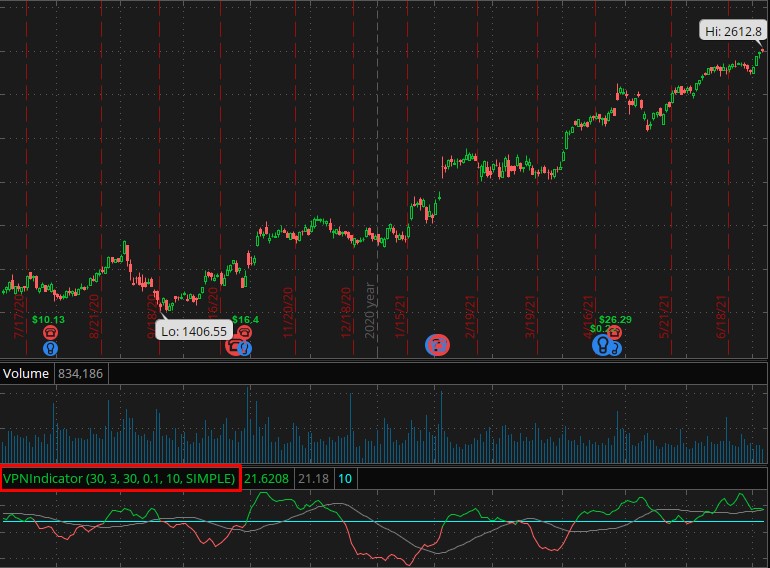
*For illustrative purposes only. Not a recommendation of a specific security or investment strategy.