Description
The Stochastic MACD indicator is a combination of the stochastic oscillator and the regular Moving Average Convergence/Divergence study. It was designed by Vitali Apirine in an attempt to measure momentum and define which MACD values correspond to overbought/oversold levels of the traded security.
Here is how Stochastic MACD is calculated:
1. Three moving averages of the specified price are calculated: slow MA, fast MA, and signal MA. By default, their lengths are 26, 12, and 9, respectively, and all of the averages are exponential. You can change these values and the type of the moving averages using study input parameters.
2. Slow and fast MAs are run through the stochastic oscillator, i.e., the relative positions of both MAs within the high-low range are found. By default, the lookup period for the high-low range is set to 45 bars. The resulting values are stochastic slow MA and stochastic fast MA, respectively.
3. The difference between the stochastic slow and stochastic fast MAs is stochastic MACD.
Positive and growing values of the Stochastic MACD may signify strong upside momentum. Negative and falling values may be a sign of strong downside momentum. Use the signal MA line to identify whether the indicator values are increasing or decreasing. Stochastic MACD's overbought and oversold levels are set to +10 and -10, respectively.
Input Parameters
| Parameter | Description |
|---|---|
stoch length
|
Lookup period for the high-low range. Used in the calculation of the stochastic moving averages. |
fast length
|
The length of the fast moving average. |
slow length
|
The length of the slow moving average. |
signal length
|
The length of the signal moving average. |
over bought
|
The overbought level. |
over sold
|
The oversold level. |
average type
|
The type of moving average to be used in calculations: simple, exponential, weighted, Wilder's, or Hull. |
Plots
| Plot | Description |
|---|---|
StochasticMACD
|
The Stochastic Moving Average Convergence/Divergence plot. |
Signal
|
The signal moving average plot. |
OverBought
|
The overbought level. |
ZeroLine
|
The zero line. |
OverSold
|
The oversold level. |
Further Reading
1. "The Stochastic MACD Oscillator" by Vitali Apirine. Technical Analysis of Stocks & Commodities, November 2019.
Example*
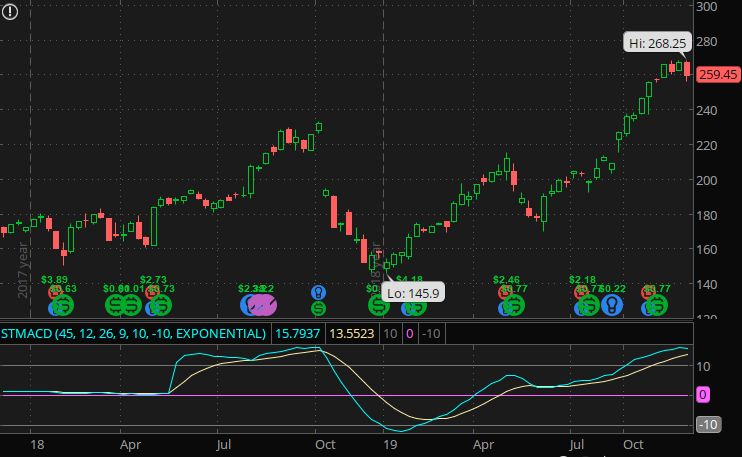
*For illustrative purposes only. Not a recommendation of a specific security or investment strategy.