Description
The Reflex indicator helps reveal market data cycles. It is based on a model that regards market data as a combination of data cycles and short-term trends. In this model, trends start at a cycle peak or valley and end at the adjacent peak or valley, correspondingly. Carefully selecting the projected cycle length and analyzing the values of the Reflex indicator, one can identify the turning points as stipulated by this model.
The Reflex indicator is calculated using the following algorithm:
- The price data is run through the EhlersSuperSmootherFilter.
- A presumed trend length is calculated based on the selected indicator (cycle) length.
- A root mean square of the average distance between the trendline and price points is found.
- The ratio of the average distance to its root mean square yields the Reflex indicator value.
When the indicator is at its maximum, a peak-to-peak trend may have come to an end. When the indicator is at its minimum, a valley-to-valley trend may have come to an end.
See also: Trendflex.
Input Parameters
| Parameter | Description |
|---|---|
length
|
The projected data cycle length. |
Plots
| Plot |
Description |
|---|---|
Reflex
|
The Reflex indicator plot. |
ZeroLine
|
The zero level. |
Example*
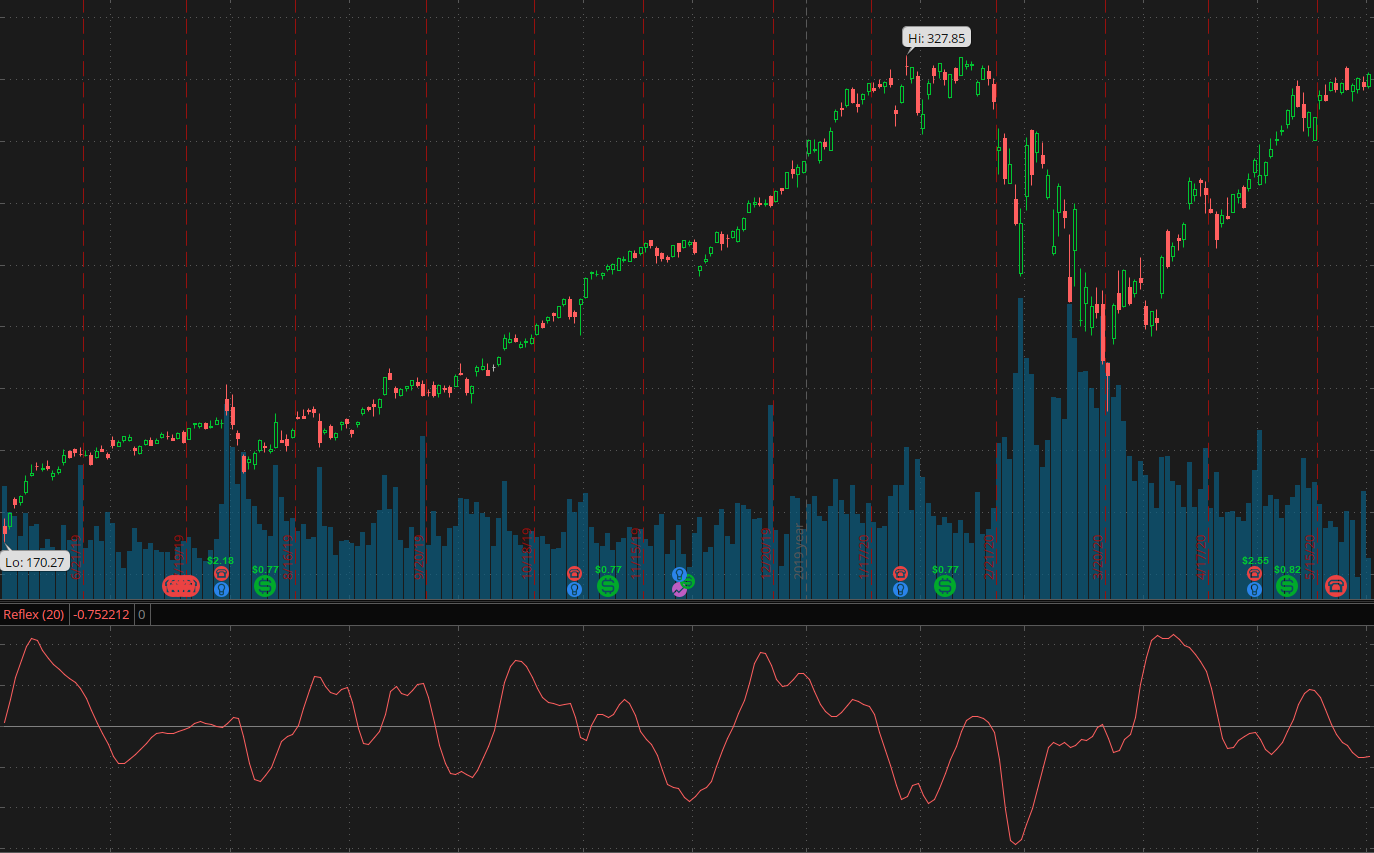 *For illustrative purposes only. Not a recommendation of a specific security or investment strategy.