Description
The Leavitt Convolution Slope study is a technical indicator designed by Jay A. Leavitt, PhD. Based on linear regression, this indicator extrapolates the linear regression of price for the next bar. Here is how Leavitt Convolution Slope is calculated:
1. Using the Time Series Forecast indicator, the study estimates the price projected for the next bar. The estimated price is based on the least-squares method.
2. Using linear regression, the study extrapolates this value to find a projected price change (convolution slope) for the next bar.
The resulting extrapolated value is shown as a histogram on a lower subgraph. By default, sections of the histogram where the extrapolated value is increasing are shown in green; sections corresponding to the decreasing value are shown in red.
Note: Value projection is purely mathematical as all calculations are based on the least-squares averaging of previous values.
Input Parameters
| Parameter | Description |
|---|---|
price
|
The price for which the convolution slope is to be found. |
length
|
The period for which the linear regression is to be calculated. |
Plots
LeavittConvolutionSlope
|
The Leavitt Convolution Slope histogram. |
ZeroLine
|
The zero level. |
Further reading
1. "Trading The Tech Emini With The Leavitt Convolution" by Jay A. Leavitt, PhD. Technical Analysis of Stocks & Commodities, January 2020.
Example*
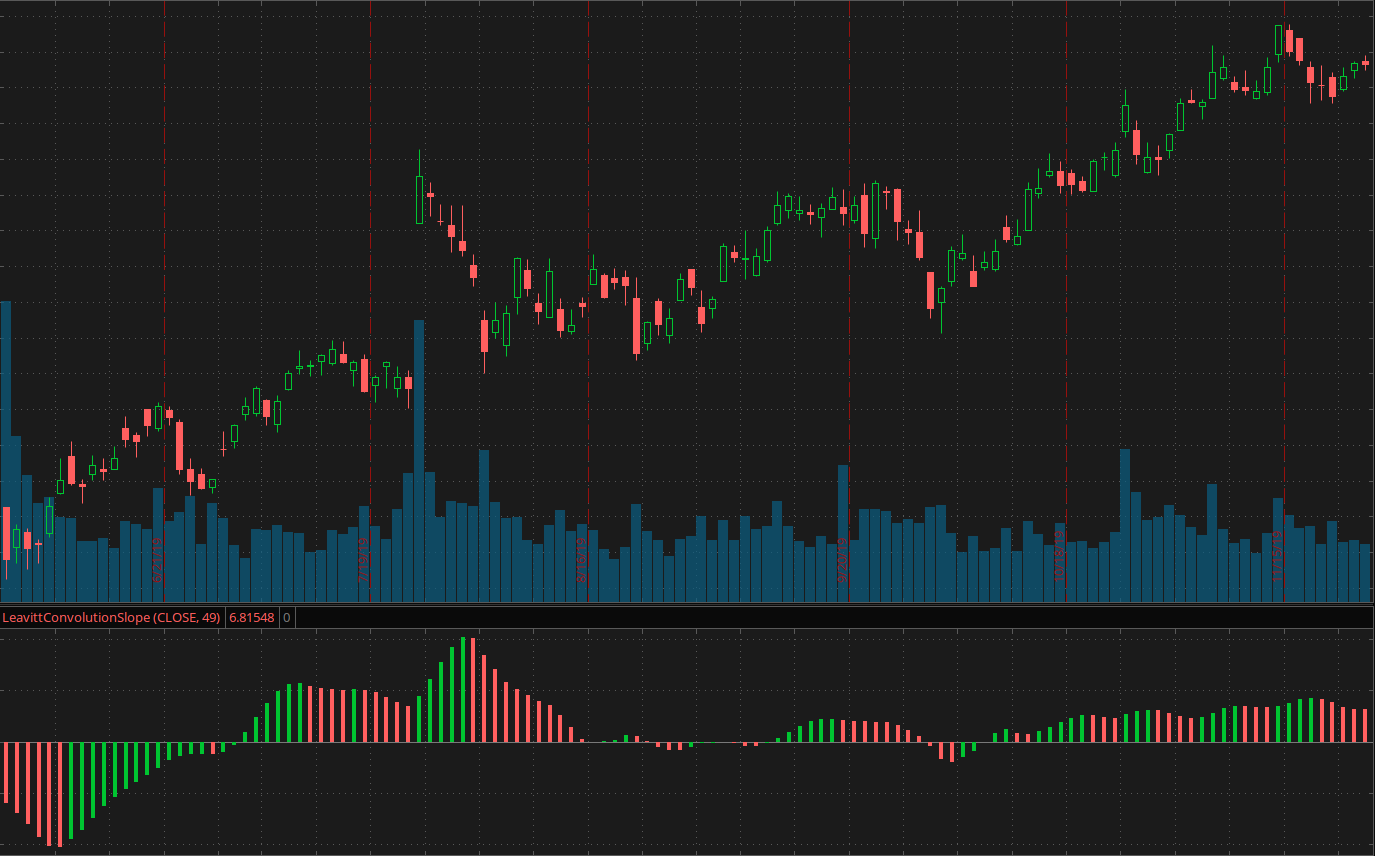 *For illustrative purposes only. Not a recommendation of a specific security or investment strategy.