Description
The Inertia study plots the linear regression curve of the Relative Volatility Index using the least-square approximation method. Much like the Relative Volatility Index itself, Inertia can be used as a confirming indicator. Readings higher than 50 indicate that the volatility is more to the upside. Readings lower than 50 indicate that the direction of volatility is to the downside.
Input Parameters
| Parameter | Description |
|---|---|
length
|
The number of bars used to calculate the linear regression curve. |
rvi length
|
The number of bars used to calculate the Relative Volatility Index. |
Plots
| Plot | Description |
|---|---|
Inertia
|
The Inertia plot. |
MiddleLine
|
The neutral volatility level. |
Example*
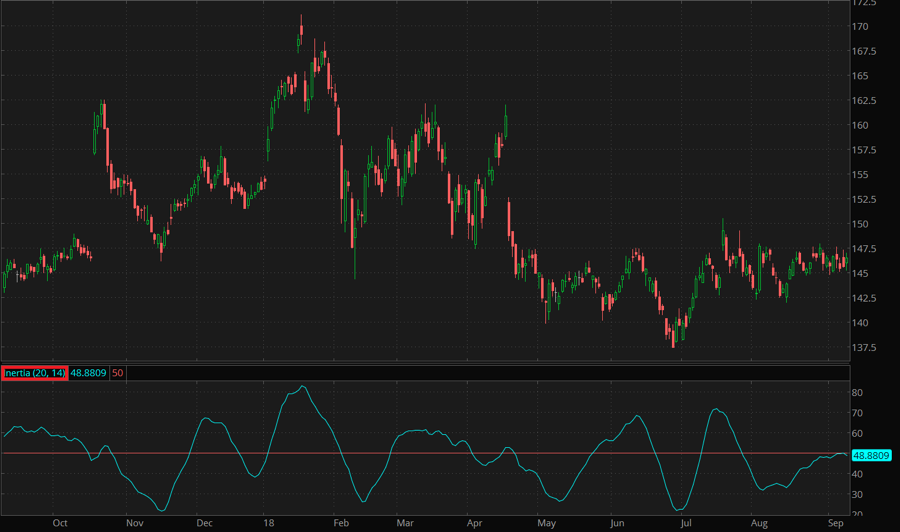
*For illustrative purposes only. Not a recommendation of a specific security or investment strategy.