Description
The HiLo Activator study is a trend-following indicator introduced by Robert Krausz as part of the Gann Swing trading strategy. In addition to indicating the current trend direction, this can be used as both entry signal and trailing stop.
Here is how the HiLo Activator is calculated:
- The system calculates the moving averages of the high and low prices over the last several candles. By default, the average is calculated using the last three candles.
- If the close price falls below the average low or rises above the average high, the system plots the opposite moving average. For example, if the price crosses above the average high, the system will plot the average low. If the price crosses below the average low afterward, the system will stop plotting the average low and will start plotting the average high, and so forth.
The plot of the HiLo Activator thus consists of sections on the top and bottom of the price plot. The sections on the bottom signify bullish trending conditions. Vice versa, those on the top signify the bearish conditions.
Input Parameters
| Parameter | Description |
|---|---|
length
|
The period on which the average high and low prices are to be found. |
Plots
| Parameter | Description |
|---|---|
BuyStop
|
The buy stop level, a moving average of the high price. |
SellStop
|
The sell stop level, a moving average of the low price. |
Further reading
1. "The New Gann Swing Chartist" by Robert Krausz, MH, BCHE. Technical Analysis of Stocks & Commodities, February 1998.
Example*
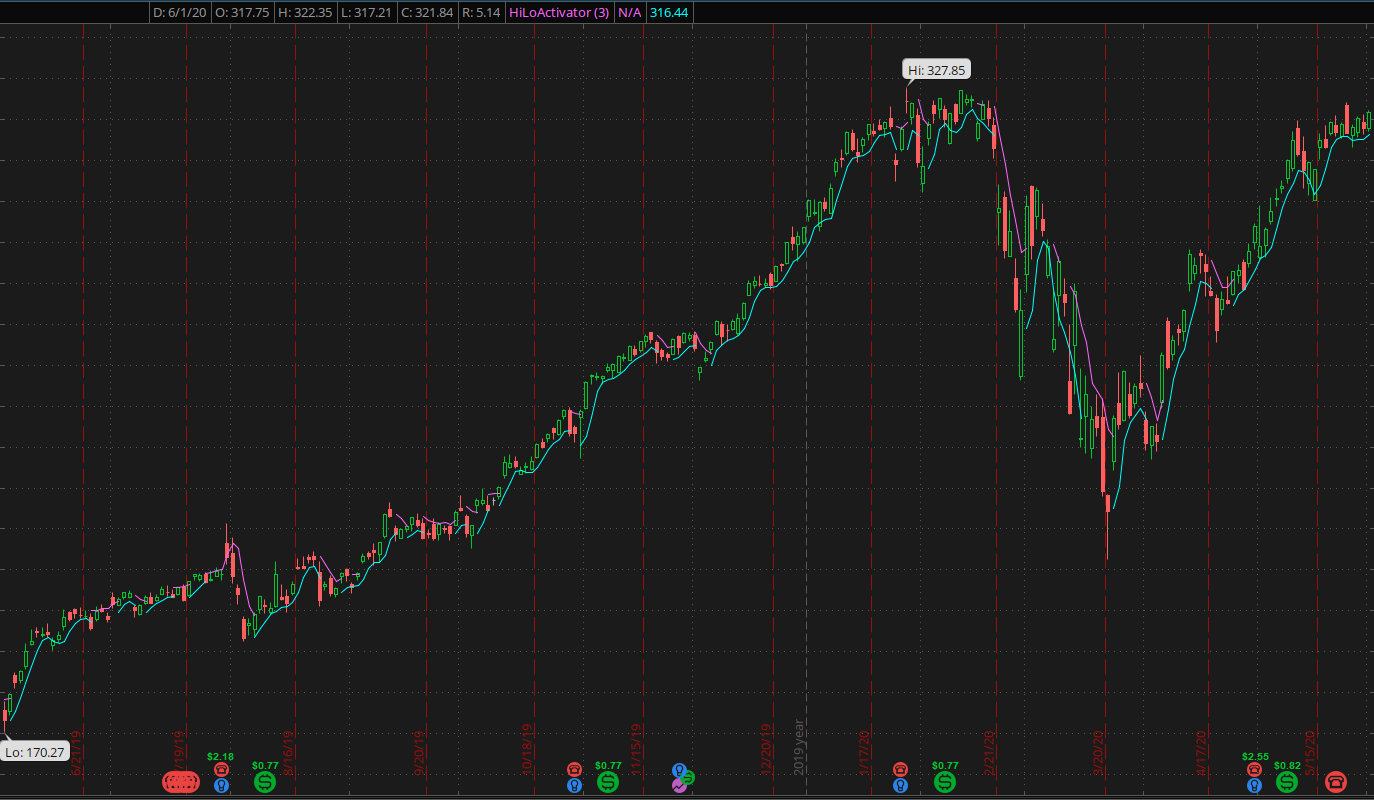 *For illustrative purposes only. Not a recommendation of a specific security or investment strategy.