Description
The Cycle Trend Analytics indicator is an oscillator that can be used for analysis of cycles and trends in the market data. It is calculated as the difference between a price component and its moving average with a variable length. Cycle Trend analytics can be used in two modes: cycle and trend. The price component is selected based on the mode.
In the cycle mode, the price component is a sinewave with a 30-bar period. In the trend mode, the close price is used as the price component. The indicator calculates 26 plots of the difference of the price component and its moving averages with lengths incrementing from 5 through 30. Each line is shown in a progressively different color on the scale from yellow to red.
The cycle mode graph represents the response to the pure cycle over the range of moving average values. In the trend mode, the same is shown for real close prices: the amount of separation between the yellowest and the reddest lines represents the strength of the current trend. High positive values of the reddest lines signify a possible uptrend, and low negative values of the reddest lines signify a possible downtrend.
In addition to the main lines, the indicator also shows a reference plot representing the diffference between the fastest and the slowest moving average.
Input Parameters
| Parameter | Description |
|---|---|
mode
|
Defines whether to output the data in the trend or the cycle mode. |
Plots
| Plot | Description |
|---|---|
Price
|
The price component: a 30-bar period sinewave in the cycle mode, or close price in the trend mode. |
MADiff
|
The difference between the 5-bar moving average and the 30-bar moving average. |
Osc05
|
The difference between the price component and its 5-bar moving average. |
Osc06
|
The difference between the price component and its 6-bar moving average. |
Osc07
|
The difference between the price component and its 7-bar moving average. |
Osc08
|
The difference between the price component and its 8-bar moving average. |
Osc09
|
The difference between the price component and its 9-bar moving average. |
Osc10
|
The difference between the price component and its 10-bar moving average. |
Osc11
|
The difference between the price component and its 11-bar moving average. |
Osc12
|
The difference between the price component and its 12-bar moving average. |
Osc13
|
The difference between the price component and its 13-bar moving average. |
Osc14
|
The difference between the price component and its 14-bar moving average. |
Osc15
|
The difference between the price component and its 15-bar moving average. |
Osc16
|
The difference between the price component and its 16-bar moving average. |
Osc17
|
The difference between the price component and its 17-bar moving average. |
Osc18
|
The difference between the price component and its 18-bar moving average. |
Osc19
|
The difference between the price component and its 19-bar moving average. |
Osc20
|
The difference between the price component and its 20-bar moving average. |
Osc21
|
The difference between the price component and its 21-bar moving average. |
Osc22
|
The difference between the price component and its 22-bar moving average. |
Osc23
|
The difference between the price component and its 23-bar moving average. |
Osc24
|
The difference between the price component and its 24-bar moving average. |
Osc25
|
The difference between the price component and its 25-bar moving average. |
Osc26
|
The difference between the price component and its 26-bar moving average. |
Osc27
|
The difference between the price component and its 27-bar moving average. |
Osc28
|
The difference between the price component and its 28-bar moving average. |
Osc29
|
The difference between the price component and its 29-bar moving average. |
Osc30
|
The difference between the price component and its 30-bar moving average. |
ZeroLine
|
The zero level. |
Example*
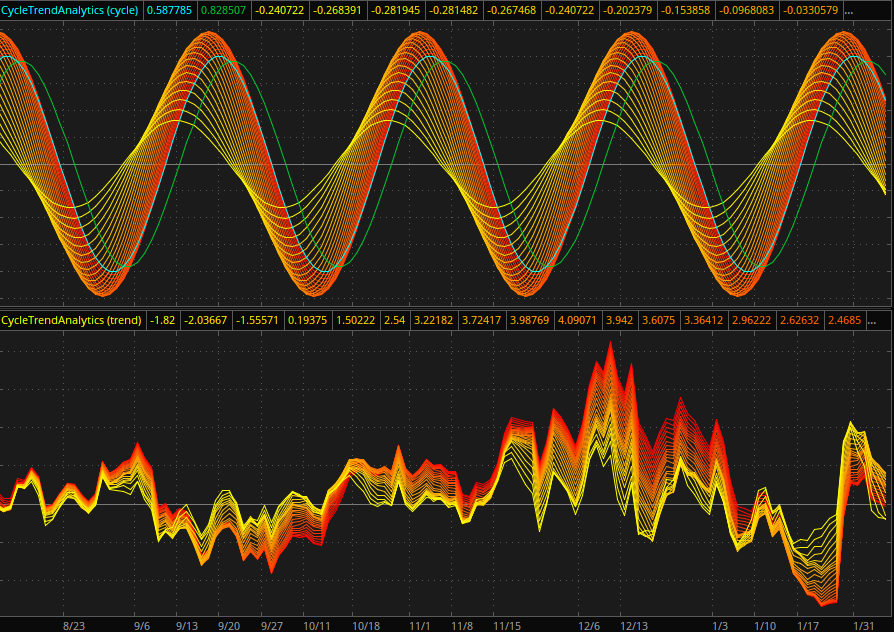
CycleTrendAnalytics in the cycle mode (top) and the trend mode (bottom)
*For illustrative purposes only. Not a recommendation of a specific security or investment strategy.