Butterfly is a Fibonacci pattern defined by five points X, A, B, C, and D, of which:
- For a bearish Butterfly, X, B, D are tops of the price plot, and A and С are bottoms.
- For a bullish Butterfly, X, B, and D are bottoms of the price plot, and A and С are tops.
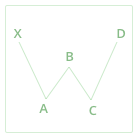
- A drive to the top is followed by a downtrend segment XA, which is then followed by an up move AB. This move is followed by a second downtrend segment BC, then an uptrend segment CD.
- XA projection is about 61.8% of AD projection.
- BC projection is about 78.6% of AB projection.
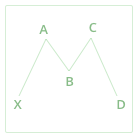
- A drive to the bottom is followed by an uptrend segment XA, which is then followed by a down move AB. This move is followed by a second uptrend segment BC, then a downtrend segment CD.
- XA projection is about 61.8% of AD projection.
- BC projection is about 78.6% of AB projection.
When the pattern is complete, it may suggest that the price is likely to further find support or resistance at one of the Fibonacci levels calculated based on the price level of point D. Note that the Fibonacci levels are only displayed for the last Fibonacci pattern on the chart.