Description
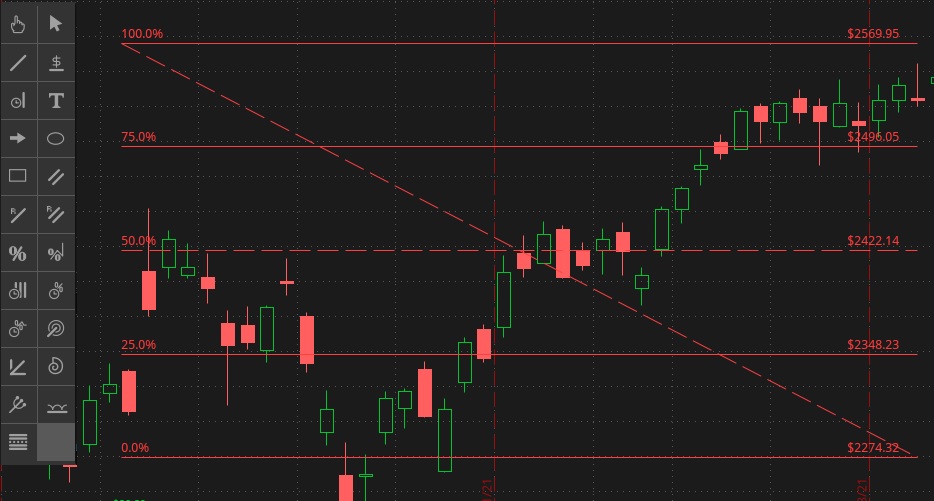
Quadrant Lines are five horizontal levels that break the specified price range into four equal parts. Each level shows the corresponding price and percentage: 100%, 75%, 50%, 25%, and 0%. By default, the drawing also shows a trendline: a dashed line that connects the drawing’s begin and end point.
To add Quadrant Lines to your chart:
- Click on the Active Tool icon.
- Choose Quadrant Lines from the menu.
- Click on a chart to specify a begin point (100%). Move your cursor and click again to specify an end point (0%).
- The price range defined by these two points will be broken into four equal parts. By default, the trendline and the middle line (50%) are shown as dashed lines.
To edit the properties of the drawing, right-click on it and choose Edit properties…
Properties
Appearance:
- Name. The name of the drawing.
- Left extension. Set this property to "On" to automatically extend the levels to the left (across the entire chart).
- Right extension. Set this property to "On" to automatically extend the levels to the right (till the end of the chart).
- Show coefficients. Specify where to display percentages corresponding to the levels: on the left, on the right, or not to show them at all.
- Show name. Specify where to show the name of the drawing: on the left, on the right, or not to show it at all.
- Show price. Specify where to display prices corresponding to the levels: on the left, on the right, or not to show them at all.
Begin point:
- Value. Defines the price value corresponding to the begin point of the trendline.
- Date/Time. Defines the time scale value corresponding to the begin point of the trendline.
End point:
- Value. Defines the price value corresponding to the end point of the trendline.
- Date/Time. Defines the time scale value corresponding to the end point of the trendline.
Quadrant Lines curve properties:
- Visible. Defines which of the lines should be visible.
- Coefficient. Defines the retracement percentage as a decimal.
- Color. Defines the color of the line.
- Style. Defines whether the line should be plotted as solid, long-dashed, or short-dashed.
- Width. Defines the line width in pixels.
Note that you can add extra and remove unnecessary lines in this section. To do so, use the Add curve and Remove curve buttons below the table.
Trendline curve properties:
- Color: The color of the trendline.
- Style: The style of the line (solid, long-dashed, or short-dashed).
- Width: The width of the line in pixels.