Seasonality is a tool designed for seasonal pattern analysis. Combining both fundamental and technical approaches, it helps evaluate seasonal price changes and seasonal trends.
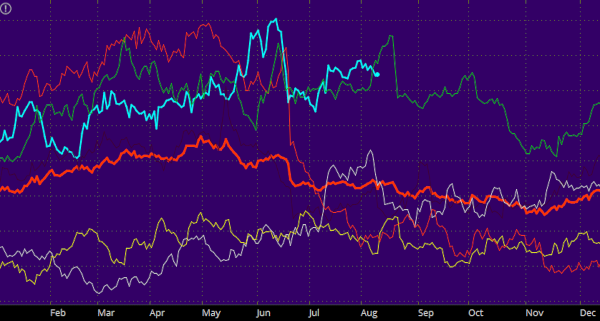
Seasonality plots daily security price for each year specified in the time frame; e.g., a 5y1d Seasonality chart plots 5 lines, each representing the daily price of the specified type: Last, Bid, Ask, or Mark. While one may benefit from analyzing the price action over season of each year, it can also be useful to compare prices on the same day of different years. As the calendrical irregularities are eliminated, none of the yearly lines have any gaps.
Several studies have been conducted in order to reveal which markets are especially sensitive to changes of seasons. These, of course, include agricultural and heating oil markets, however, Seasonality can be successfully applied to many other types of price data.
While keeping many features of the standard chart mode, Seasonality charting has several peculiarities. Since multiple data points are plotted for a single time interval, the volume is not shown. For the same reason, studies cannot be applied to Seasonality charts. Instead, Appearance settings allow you to view the yearly lines along with their averages. You're also free to add several types of drawings to the Seasonality chart: Trendline, Price Level, Time Level, Text Note, Arrow, Oval, Rectangle, Channel, Fibonacci Retracements, Fibonacci, Extensions, Fibonacci Fans, and Andrew's Pitchfork. In addition, you can have the Seasonality chart display available corporate actions; to do so, navigate to the Equities Settings dialog and select Show Corporate Actions.
When you enable the percentage mode for the price axis, each line has its own calculation algorithm: the first day's close price of each year is used as the reference level for each line, so all of them have the same point of origin.
You can fine-tune Seasonality chart using several options described in the Appearance Settings article.