The Stock Hacker Scanning Tool allows you to search for symbols meeting certain criteria. Study filters are criteria based on study values: adding one or several study filters will help you narrow the search range when looking for symbols. You can use up to 25 filters to scan the market.
How to Find It:
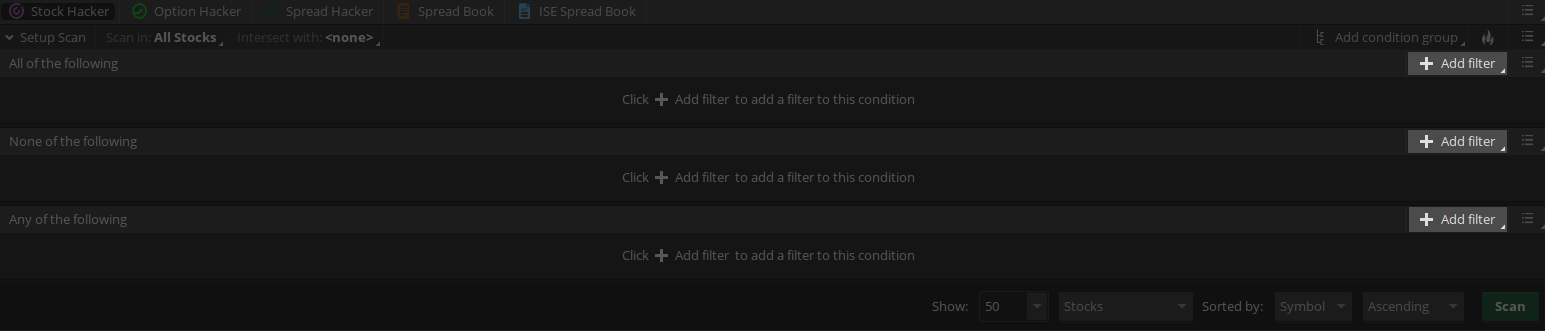
1. Click the Scan tab and choose Stock Hacker from the sub-tab row.

2. In the condition group you would like to add a study filter to, click on the Add filter dropdown. Choose Study. A new study filter editor will appear.
3. The first field of the editor allows you to choose a custom or pre-defined study to filter the results. Choose the desirable study and adjust input parameters.
Note that you can set a custom aggregation period by clicking on the Aggregation Period button. For intraday aggregations, you can choose whether or not to include the Extended-Hours Trading session: use the EXT checkbox for that.
4. Click Scan. Search results will be shown in the watchlist form below the Filters section.
5. If pre-defined study filters are not enough for your scan, you can create custom study filters. To do so, choose Custom from the study list. This will open the Scanner Custom Filter editor window.
In Scanner Custom Filter, you can either use Condition Wizard, an interface that is operated by human-readable expressions, or thinkScript Editor, an interface for creation of thinkScript-based studies.
Example
Consider the following script:
close > expaverage(close, 60) and ADX(length = 14) > 18
This condition is used in the Volume Zone Oscillator study; it checks whether the price is above the 60 period EMA and 14 period ADX value is higher than 18, which could possibly mean that the market is in strong uptrend. Click OK save the filter and then press Scan to display all symbols meeting this criterion.
You can also use plot values in Study Filters:
def SMA = Average(close, 15);
plot condition = close[2] > SMA[2] and close[1] < SMA[1] and close < SMA;
This example script searches for symbols which were above simple moving average two days ago, but have fallen below since then.
Note that search criteria can be adjusted by pressing the "pencil" icon in the filter. To delete a filter, click X.
Note also that search results are displayed in the watchlist form, which means that you can display custom quotes along with standard values. For more information on that, refer to the Custom Quotes article.
Specific Usage
When in Stock Hacker, thinkScript® usage is somewhat different from that in studies and strategies. Here is the list of peculiarities:
-
Secondary aggregation is not allowed.
-
Scripts using standard thinkScript® syntax must have exactly one plot.
-
For forex, only price type last can be used.
-
The "Start aggregations at market open" setting is disabled when the Extended-Hours Trading session is off.
Data Limitations
Data used in study filters is limited in terms of time period. These limitations depend on the aggregation period:
| Aggregation period | Data limit |
| 1 to 30 min | 15 astronomical days |
| 1 to 4 hours | 270 astronomical days |
| 1 to 4 days | 4 years |
| Week | 6 years |
| Month, Option Expiration | 20 years |