Learning Center
If you're looking for tutorials, reference, or quick guides, stop: everything's right here, in thinkorswim Learning Center. Take a look around!
Featured
Several highlights we've selected for you.
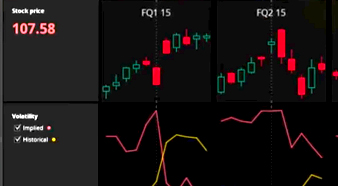
Earnings
The Earnings feature demonstrates the relationship between earnings announcements and pricing of securities and derivatives. Earnings events are displayed along with corresponding pricing and volatility data. Watch the video below to learn about all useful tools in the Earnings feature.
Getting Started
The working area of the thinkorswim platform can be divided into two parts: the left sidebar and the main window. The left sidebar is where you keep gadgets necessary for your work. The main window contains eight tabs, which provide you with numerous kinds of functionality: Monitor, Trade, Analyze, Scan, MarketWatch, Charts, Tools, and Help. All these tabs also have subtabs, each dedicated to a certain thinkorswim feature. The manual you’re reading now describes these features in detail (refer to the corresponding pages for more information), but for now, let’s focus on what can be found under the seven main tabs:
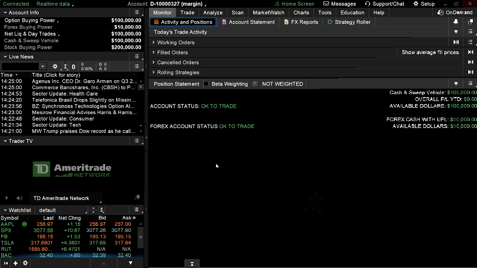
The Monitor tab is the primary location where your trading activity is tracked. This includes many kinds of data: your orders, positions, statements, cash balances, and trading account status.
The Trade tab contains the following interfaces: All Products, Forex Trader, Futures Trader, Pairs Trader, and Active Trader.
The Analyze tab provides you with analysis techniques of many kinds, including simulation of "what-if scenarios" on both real and hypothetical trades, volatility and probability analyses, the Economic Data indicator database, and option back-testing.
The Scan tab enables you to filter through tens of thousands of stock, option, futures and forex products available based on your search criteria.
The MarketWatch tab provides you with market data of many kinds as well as techniques that will help you process it. The following sub-tabs are available in MarketWatch: Quotes, Alerts, Visualize, Financing Rates, and Calendar.
The Charts tab provides you with a powerful graphic interface of real-time market data with an extensive selection of technical analysis tools.
The Tools tab encompasses several handy thinkorswim features: thinkLog, Videos, and Shared Items.
Today's Option Statistics
The Today’ Options Statistics section displays the detailed options data. To view the data, click on the V-shaped icon before the section title.
You can find the following kinds of data in Today’ Options Statistics:
1. The first section to the left displays a breakdown of the chosen security’s volatility measurements. There are two data points:
- IV (Implied Volatility) is a measure of market sentiment regarding the security’s potential movement. In general, the higher the implied volatility, the higher the option’s premium.
- HV (historical volatility) attempts to measure a security’s potential price movement based upon the ranges of price movement a security has historically shown.
The first section displays the 52-week high and low of both of these volatility measurements as well as the percentile of volatility relative to that range.
The final value in this section is the VWAP, which stands for Volume Weighted Average Price. VWAP is a measure of the underlying’s price based on the number of shares or contracts traded at different prices.
2. The area in the center is Trade Analysis. This collates the records of all options trades recorded for the current date and breaks them down into useful classifications.
The three different colored columns represent sums of the rows for Calls, Puts, and the aggregated total. The following rows are shown:
- Total volume: The aggregate volume of each of these three columns for the current trading day.
- Traded at BID or below: The total number of contracts traded at or below the bid price at the time of their execution.
- % of Total: The percentage of “Traded at BID or below” relative to the total number of calls, puts, or all options traded.
- Traded at ASK or above: The total number of contracts traded at or above the ask price at the time of their execution.
- % of Total: The percentage of “Traded at ASK or above” relative to the total number of calls, puts, or all options traded.
- Between the Market: The total number of contracts traded at a price between the quoted bid and ask at the time of execution.
- %of total: The percentage of contracts traded “between the market” relative to the total number of calls, puts, or all options traded.
- Delta between: Collective deltas of all options at the time they were traded divided into quintiles. To simplify the display, the deltas of both calls and puts are shown as their absolute value for convenience if you are comparing the delta values in the puts column to the puts section of the option chain.
Note: A negative delta on the chain is equivalent to the positive value on the options statistics page.
3. The final section on the far right contains data based on Sizzle Index. Sizzle Index is a ratio of the current day’s volume for all options on the underlying against the average of those options previous five days’ volume.
In addition to the Sizzle Index, the following values are displayed in this section:
- Call and Put Sizzle Indices: These indices measure solely the volumes of that underlying’s calls and puts.
- Volatility sizzle: This index measures the underlying’s current Volatility Index against the average of the past five days.
- Stock Sizzle: This index measures the underlying’s trading volume against the average of the past five days.
- Put-Call ratio: The ratio of the underlying’s put volume to its call volume.