Description
The IFT Stochastic Oscillator study is an oscillator which combines Inverse Fisher Transform (IFT) and Stochastic approaches in order to suggest buying and selling opportunities. Two main plots compile the oscillator: Stochastic and IFT.
Stochastic plot values are derived by applying the basic Stochastic formula to the rainbow-averaged price data in order to reduce whipsaws. The main idea of rainbow averaging is taking 10 WMAs of Close price and applying a transformed weighted average to them.
The other plot, IFT, represents values derived after applying the Inverse Fisher Transform to values of the Stochastic plot. Inverse Fisher Transform is calculated using the formula:
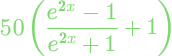
Note that this formula differs from standard IFT: coefficients 50 and 1 are involved so that the [-1; 1] range is converted to [0; 100].
In order to find buying and selling opportunities, use the IFT plot in combination with auxiliary overbought and oversold levels.
Input Parameters
| Parameter | Description |
|---|---|
price
|
The price used in calculations. |
length
|
The number of bars in the main period in Stochastic calculation. |
slowing length
|
The number of bars in the slowing period in Stochastic calculation. |
over bought
|
The overbought level |
over sold
|
The oversold level |
Plots
| Plot | Description |
|---|---|
Stochastic
|
The Stochastic plot. |
IFT
|
The IFT plot. |
OverBought
|
The overbought level. |
OverSold
|
The oversold level. |
Further Reading
1. "Applying the Put/Call Ratio Indicator" by Sylvain Vervoort. Technical Analysis of Stocks & Commodities, December 2011.
Example*
*For illustrative purposes only. Not a recommendation of a specific security or investment strategy.