In the Position Statement section of the Activity and Positions tab, you can track your current positions, view and analyze their underlying breakdown, roll and close trades, use the Beta Weighting tool, and read the news on all the symbols currently present in your portfolio.
Grouping and arranging positions
In Position Statement, you can group symbols you have the positions on and arrange the positions within the groups. To do so:
- Click on the Show Actions Menu button and activate the Show Groups checkbox. This will turn on the symbol grouping.
- Click on the Show Actions Menu button again and navigate to Group symbols by. Here, you can group your symbols by Type, Industry, Capitalization, or Account. In addition, you can organize your options positions by type such as single option position, vertical spread, iron condor, etc.
- If you have too many groups, consider activating the Merge similar groups checkbox in the Show Actions menu.
- To arrange positions within groups, go to Show Actions menu again and navigate to Arrange positions. Here, you can arrange your positions by Instrument, Trade time, or Order.
Managing equity positions
If your symbols are grouped by Type, all equity positions are contained in the Equities and Equities Options subsection. Here is how you can manage your equity positions in this subsection:
- Click on the V-shaped arrow to the left of the Equities and Equities Options dropdown so that it expands. You will see all your equity positions sorted alphabetically by symbol.
- Click on the small triangle arrow to the left of any symbol name so your position specs populate. Below each symbol name, you will see the full name of the underlying stock. To the left of the company name, you will see an icon that denotes your position side: a green BUY for a long position or a red SELL for a short one.
- In addition, you will see the following specs:
- Quantity: The number of contracts purchased
- Mark: The mid-point between the bid and the ask
- Mark Change: The change in mark price since the position was opened
- P/L Open: The profit or loss since the position was opened
- P/L Day: The profit or loss for the current day
- BP Effect: The impact on your margin or buying power
- Below the Equities and Equities options, you can see the following figures: Selected Totals, Subtotals, Overall Totals, Cash & Sweep Vehicle Totals, Overall P/L YTD (your profit or loss year-to-date), and Available Dollars. Each one of these key numbers represents collective criteria in which to evaluate your positions for portfolio management and/or trading purposes.
- You can adjust your positions in Position Statement. To do so, right-click on the position you would like to adjust and select Adjust position... Adjust your position in the dialog that appears afterwards.
-
By a right-click on a position, you have the following options: create a closing order for the trade, analyze your closing trade, move your trade to a different group, and view orders relative to this position.
In addition, you can analyze the underlying by charting it, create new alerts, trades or notes on it, or view the respective company's data.
Managing options positions
If your symbols are grouped by Type, all options positions are contained in the Equities and Equities Options subsection. Here is how you can manage your options positions in this subsection:
- To view an options position, expand the symbol dropdown that contains it. Remember: you can group your options positions based on the option/spread type; this action is available from the Show Actions menu.
-
Metrics for options positions include the "Greeks": Delta, Gamma, Theta, and Vega. These metrics are updated in real-time so you can make appropriate position adjustments. Positions are adjusted the same way as for equities.
-
For complex options such as vertical, calendar, diagonal spreads, etc, depending on the margin requirement or type of account, you may have the ability to close out your position as a whole unit or in partial (i.e. spreads, individual legs, etc.).
Place your cursor along the line-item position summary, right-click with your mouse, and drag your cursor over the series of option legs that you want to close out, analyze or roll. For example, if you are currently in an iron condor position that you want to exit in partial or in full, you can close it out as a vertical spread, a strangle, a combo, or by individual legs.
In addition to the Greeks and the standard specs such as Position Quantity, Mark, P/L Open, P/L Day, and BP Effect, Options section also provides a "days to expiration" reminder and an option status identifier (if you see an “ITM” icon next to the symbol it indicates that your option is currently “in the money”).
News/Portfolio Digest
In the News/Portfolio Digest section, you can view the feed of news items related to the symbols currently present in your portfolio. Each news item shows the time of release, headline, and the list of symbols mentioned in it. The newsfeed is periodically updated, and you can see the timestamp of the latest update in the section header.
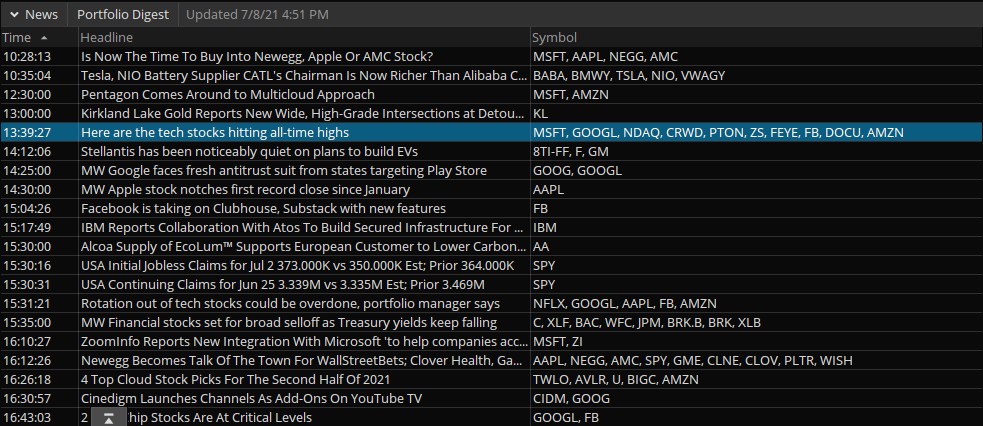
Here is how you can use the newsfeed:
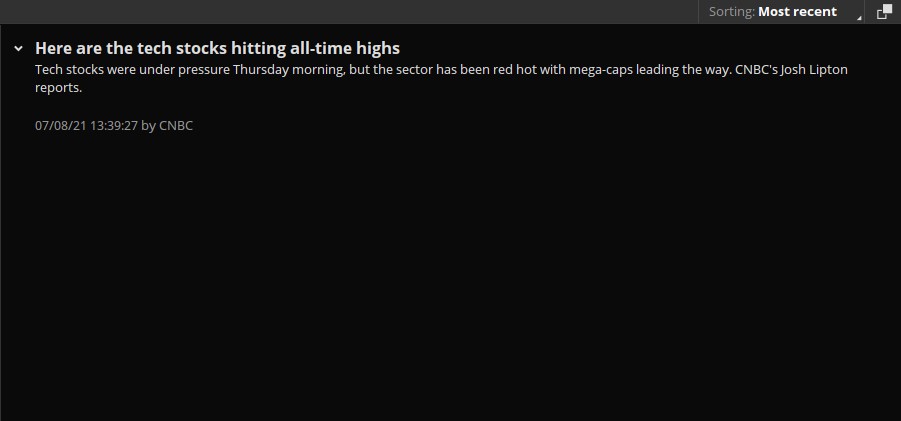
- Click on any item to read it in full in the reading pane to the right.
- In addition to the main news, the reading pane can also display related stories. The related stories are shown below the main one and are collapsed by default. Click on the Expand icon to the left of the headline of a related item to read it in full.
- You can sort your newsfeed either chronologically or by relevance. To switch between the sorting modes, use the Sorting selector in the top-right corner of the section.
- Click on the Detach icon in the top-right corner of the News/Portfolio Digest to display this section in a separate window.
Note: Only up to 20 of the most recent and relevant items can be shown in the News/Portfolio Digest. By default, the items are ordered by relevancy.